

- Data teams are crucial for the success of data projects, requiring collaboration between data science, data engineering, and operations.
- Companies with all three teams or at least data science and data engineering teams show higher success rates in creating value from data projects.
- Friction, lack of individual contributors, and challenges in technology productionization are major obstacles to achieving high value from data projects.
- Best practices include close collaboration with the business, continuous integration, technology selection based on business needs, and leveraging automation for task simplification.
- Successful value creation from data projects is linked to having teams with the right skills, focusing on velocity, using automation, and promoting listening and shared responsibility.
Between August 19, 2020, and October 17, 2020, I ran a survey to get more data for my latest book Data Teams. Overall, we had 86 respondents.
This survey was designed to get information about how management uses data teams, the value they’re creating, and how they’re creating it. The survey asked the best and worst practices that teams are using or experiencing. We rounded out the survey by asking about COVID-19’s effect on data teams. In this post, I’ll go through the survey results and analysis of what the results mean.
Demographic Data

Figure 1 – What is your position at your company?
Since the survey is concerned with management, we’ll start with the breakdown of positions. 67.5% have a management position. The other positions represented were data engineers, consultants, project managers, and project managers.
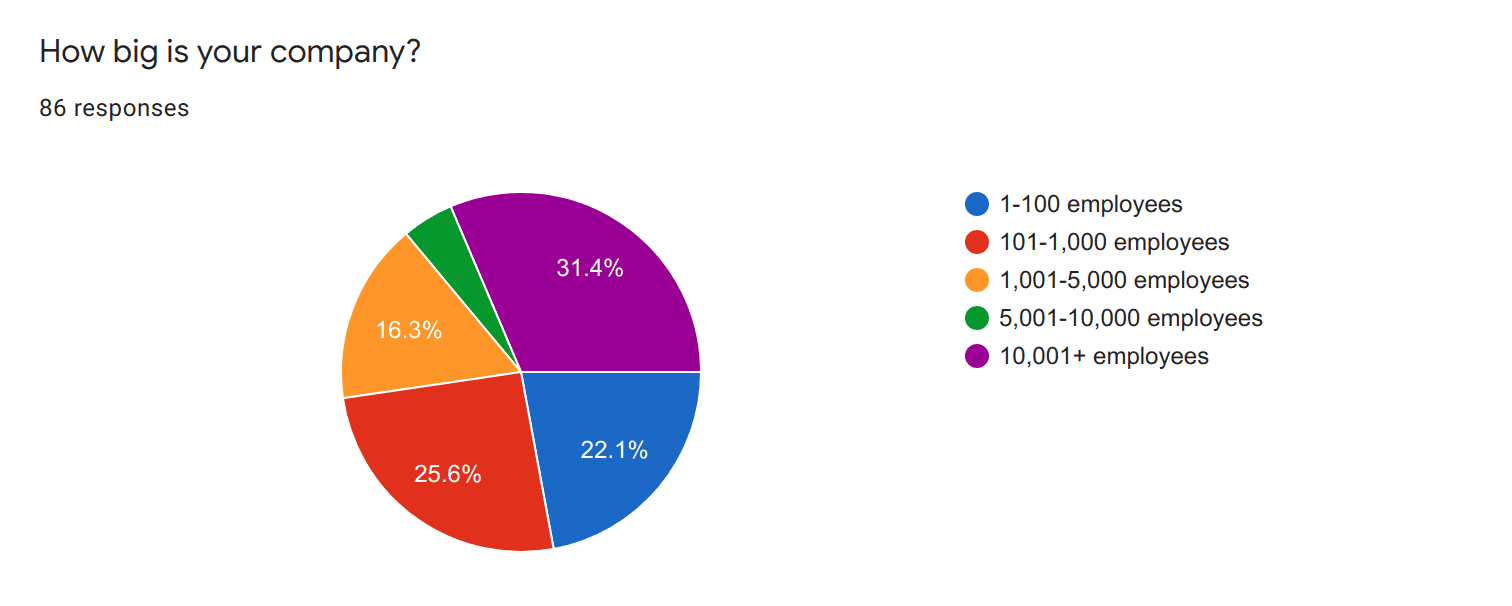
Figure 2 – How big is your company?
Another critical question is the size of the companies represented. Companies at different sizes have different organizational needs, and we can see there is a vast number of employees represented.
Data Teams
The fundamental thesis of Data Teams is that companies need data science, data engineering, and operations to be successful in their data projects. We start asking some questions about each respondent’s data teams.
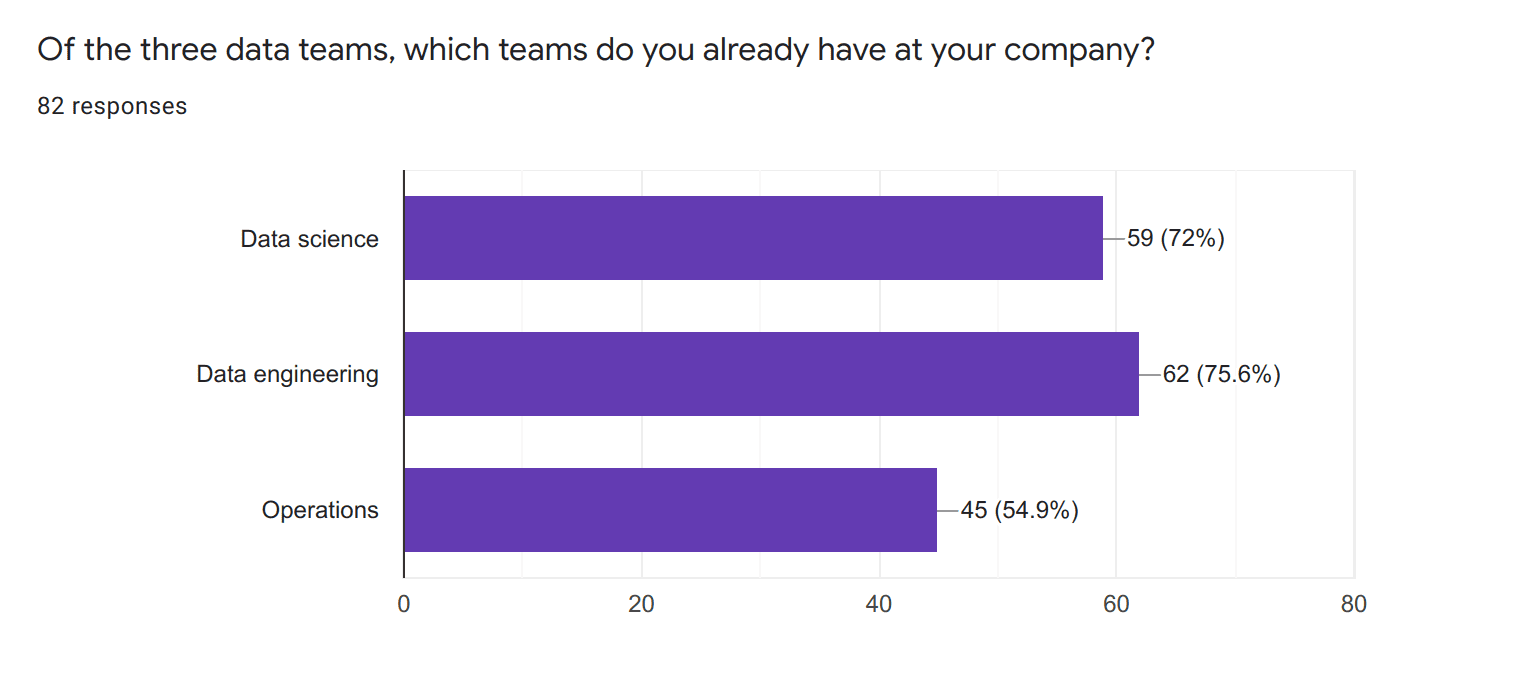
Figure 3 – Of the three data teams, which teams do you already have at your company?
We see that data science and data engineering are well-represented. However, operations teams are only present in half of the respondents.
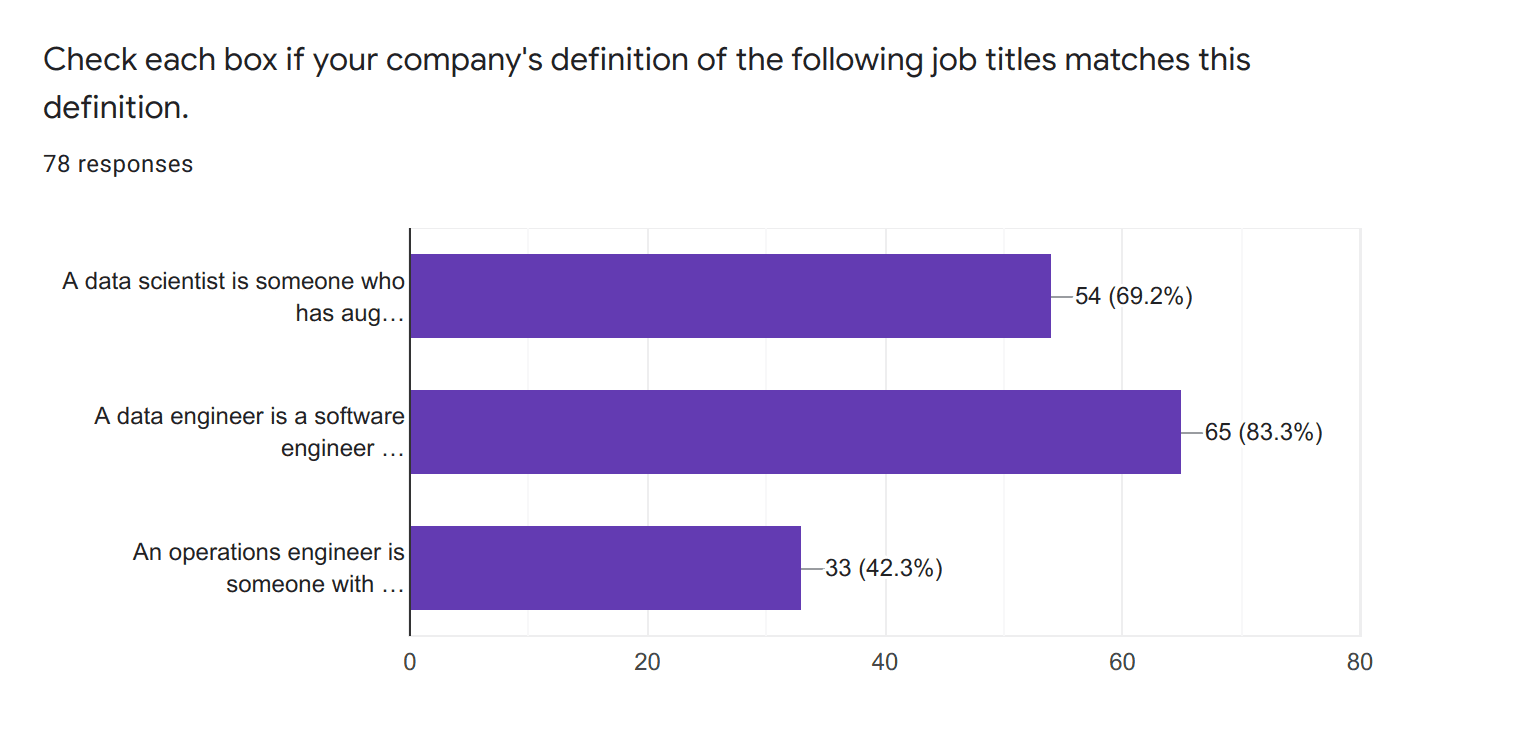
Figure 4 – Does the company definition of a team match the book’s definition?
Merely saying you have a team doesn’t mean it’s the right team. The individual contributors have to meet the criteria and definitions to truly represent the job title. We see similarly well-represented responses for data scientists and data engineers with operations lagging.
Overall, we see opportunities to improve operations. These improvements include both the presence of operations and getting the right people in place.
Maturity and Success
It’s essential to gauge how far along the respondents are in their big data journey.
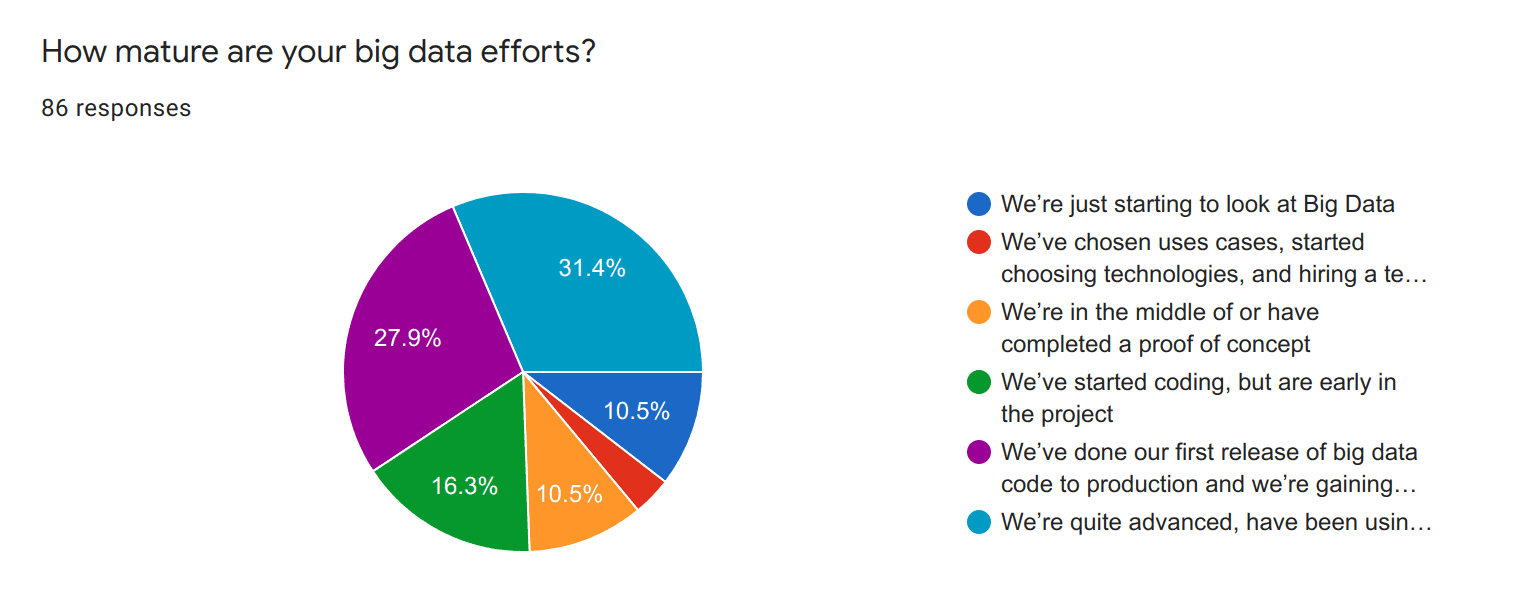
Figure 5 – How mature are your big data efforts?
59.3% of respondents said they are in production or further along, while 40.7% are in pre-production.
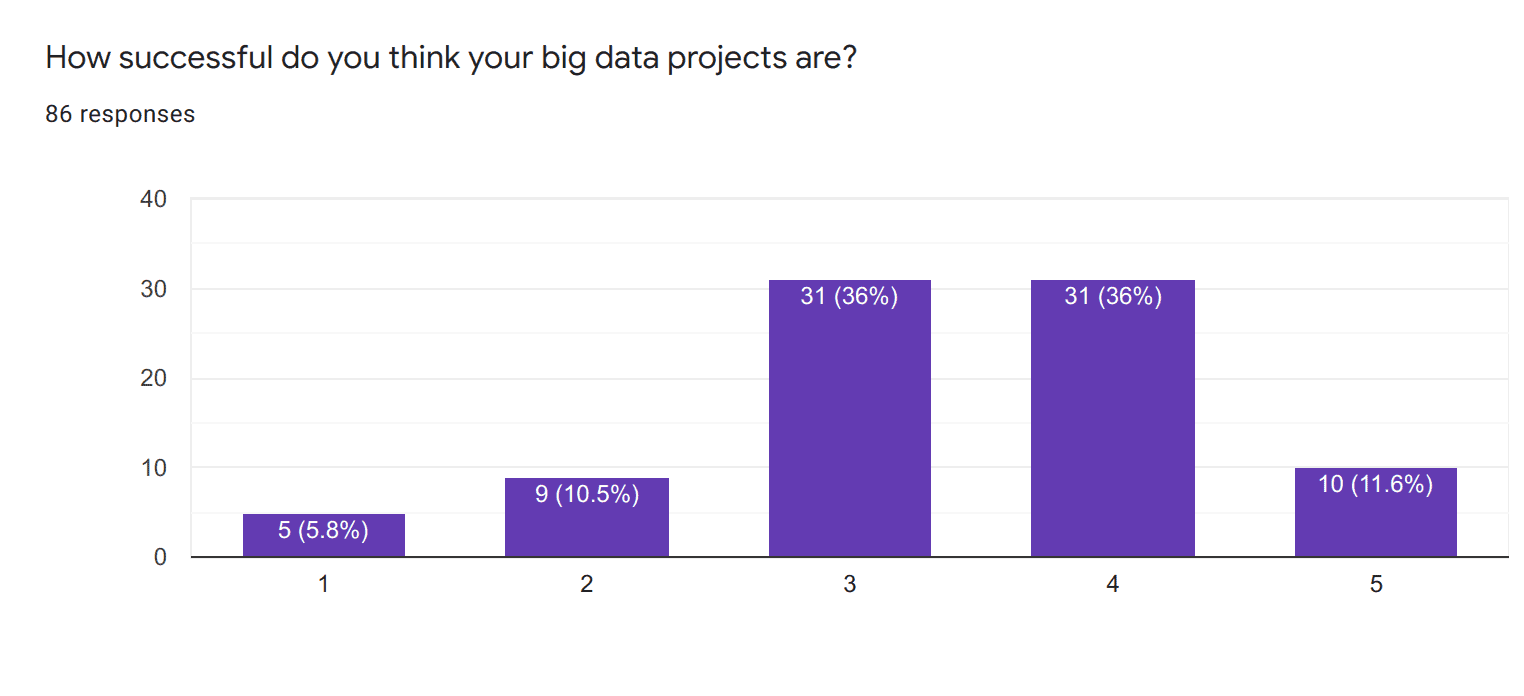
Figure 6 – How successful do you think your big data projects are? 1 means “Highly Unsuccessful” and 5 means “Highly Successful”.
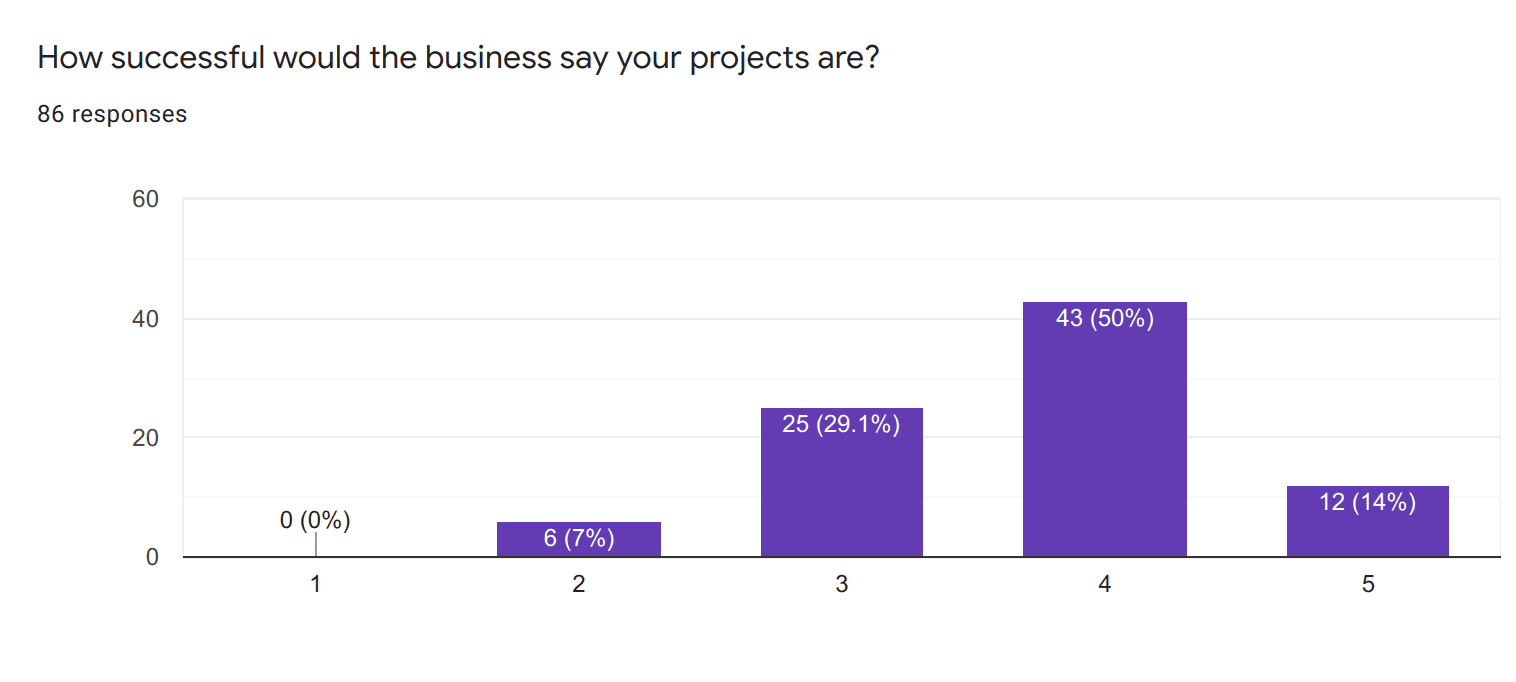
Figure 7 – How successful would the business say your projects are? 1 means “Highly Unsuccessful” and 5 means “Highly Successful.”
I’ve found perceptions of success to be highly varied. To get a higher fidelity of success, I asked two questions. I asked respondents how they felt and what the business would say about the success (the higher the number, the more successful the project). From the responses, the individuals thought that the business would say they’re more successful than what they would say.

Figure 8 – Combined business and personal project success metric
To get a combined view of the business and personal opinions of success, I added the two numbers to get a range of 1 to 10. This combination showed predominantly 7 and 8 ratings for respondents.
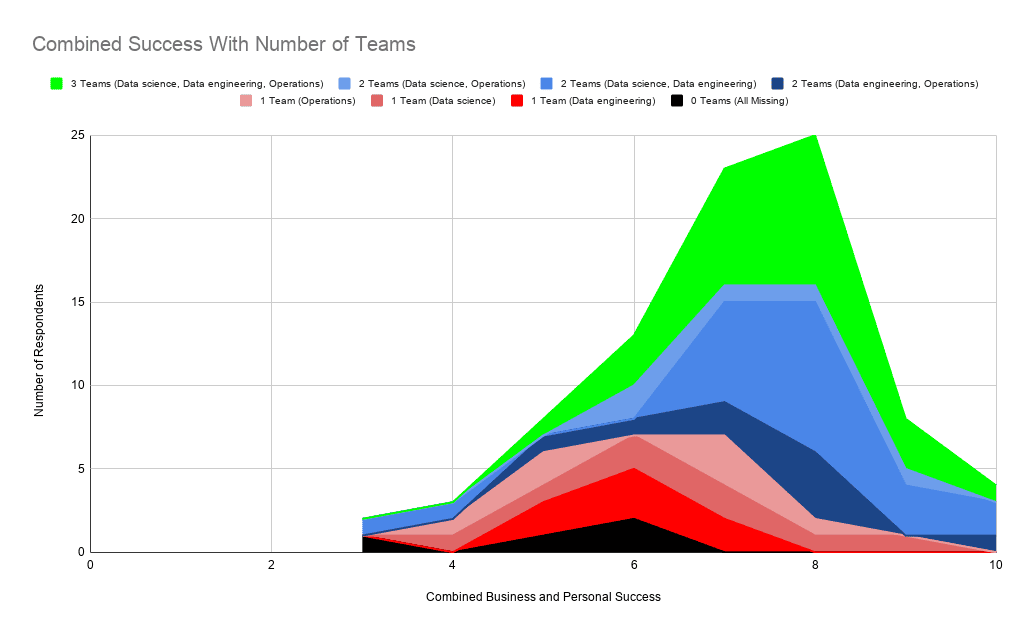
Figure 9 – Combined success with team representation breakdown
Taking the perceived combined business and personal success, I then broke out success grouped with which teams the organization had. We can see some clear correlations:
- Having all three teams (green) or data science and data engineering (medium blue) creates the highest success
- Companies with data science and operations (light blue) or data engineering and operations (dark blue) have more difficulty creating success and are less popular
- Companies with only one team (shades of red) have great difficulty creating high value
- When all teams are missing, there is the lowest success
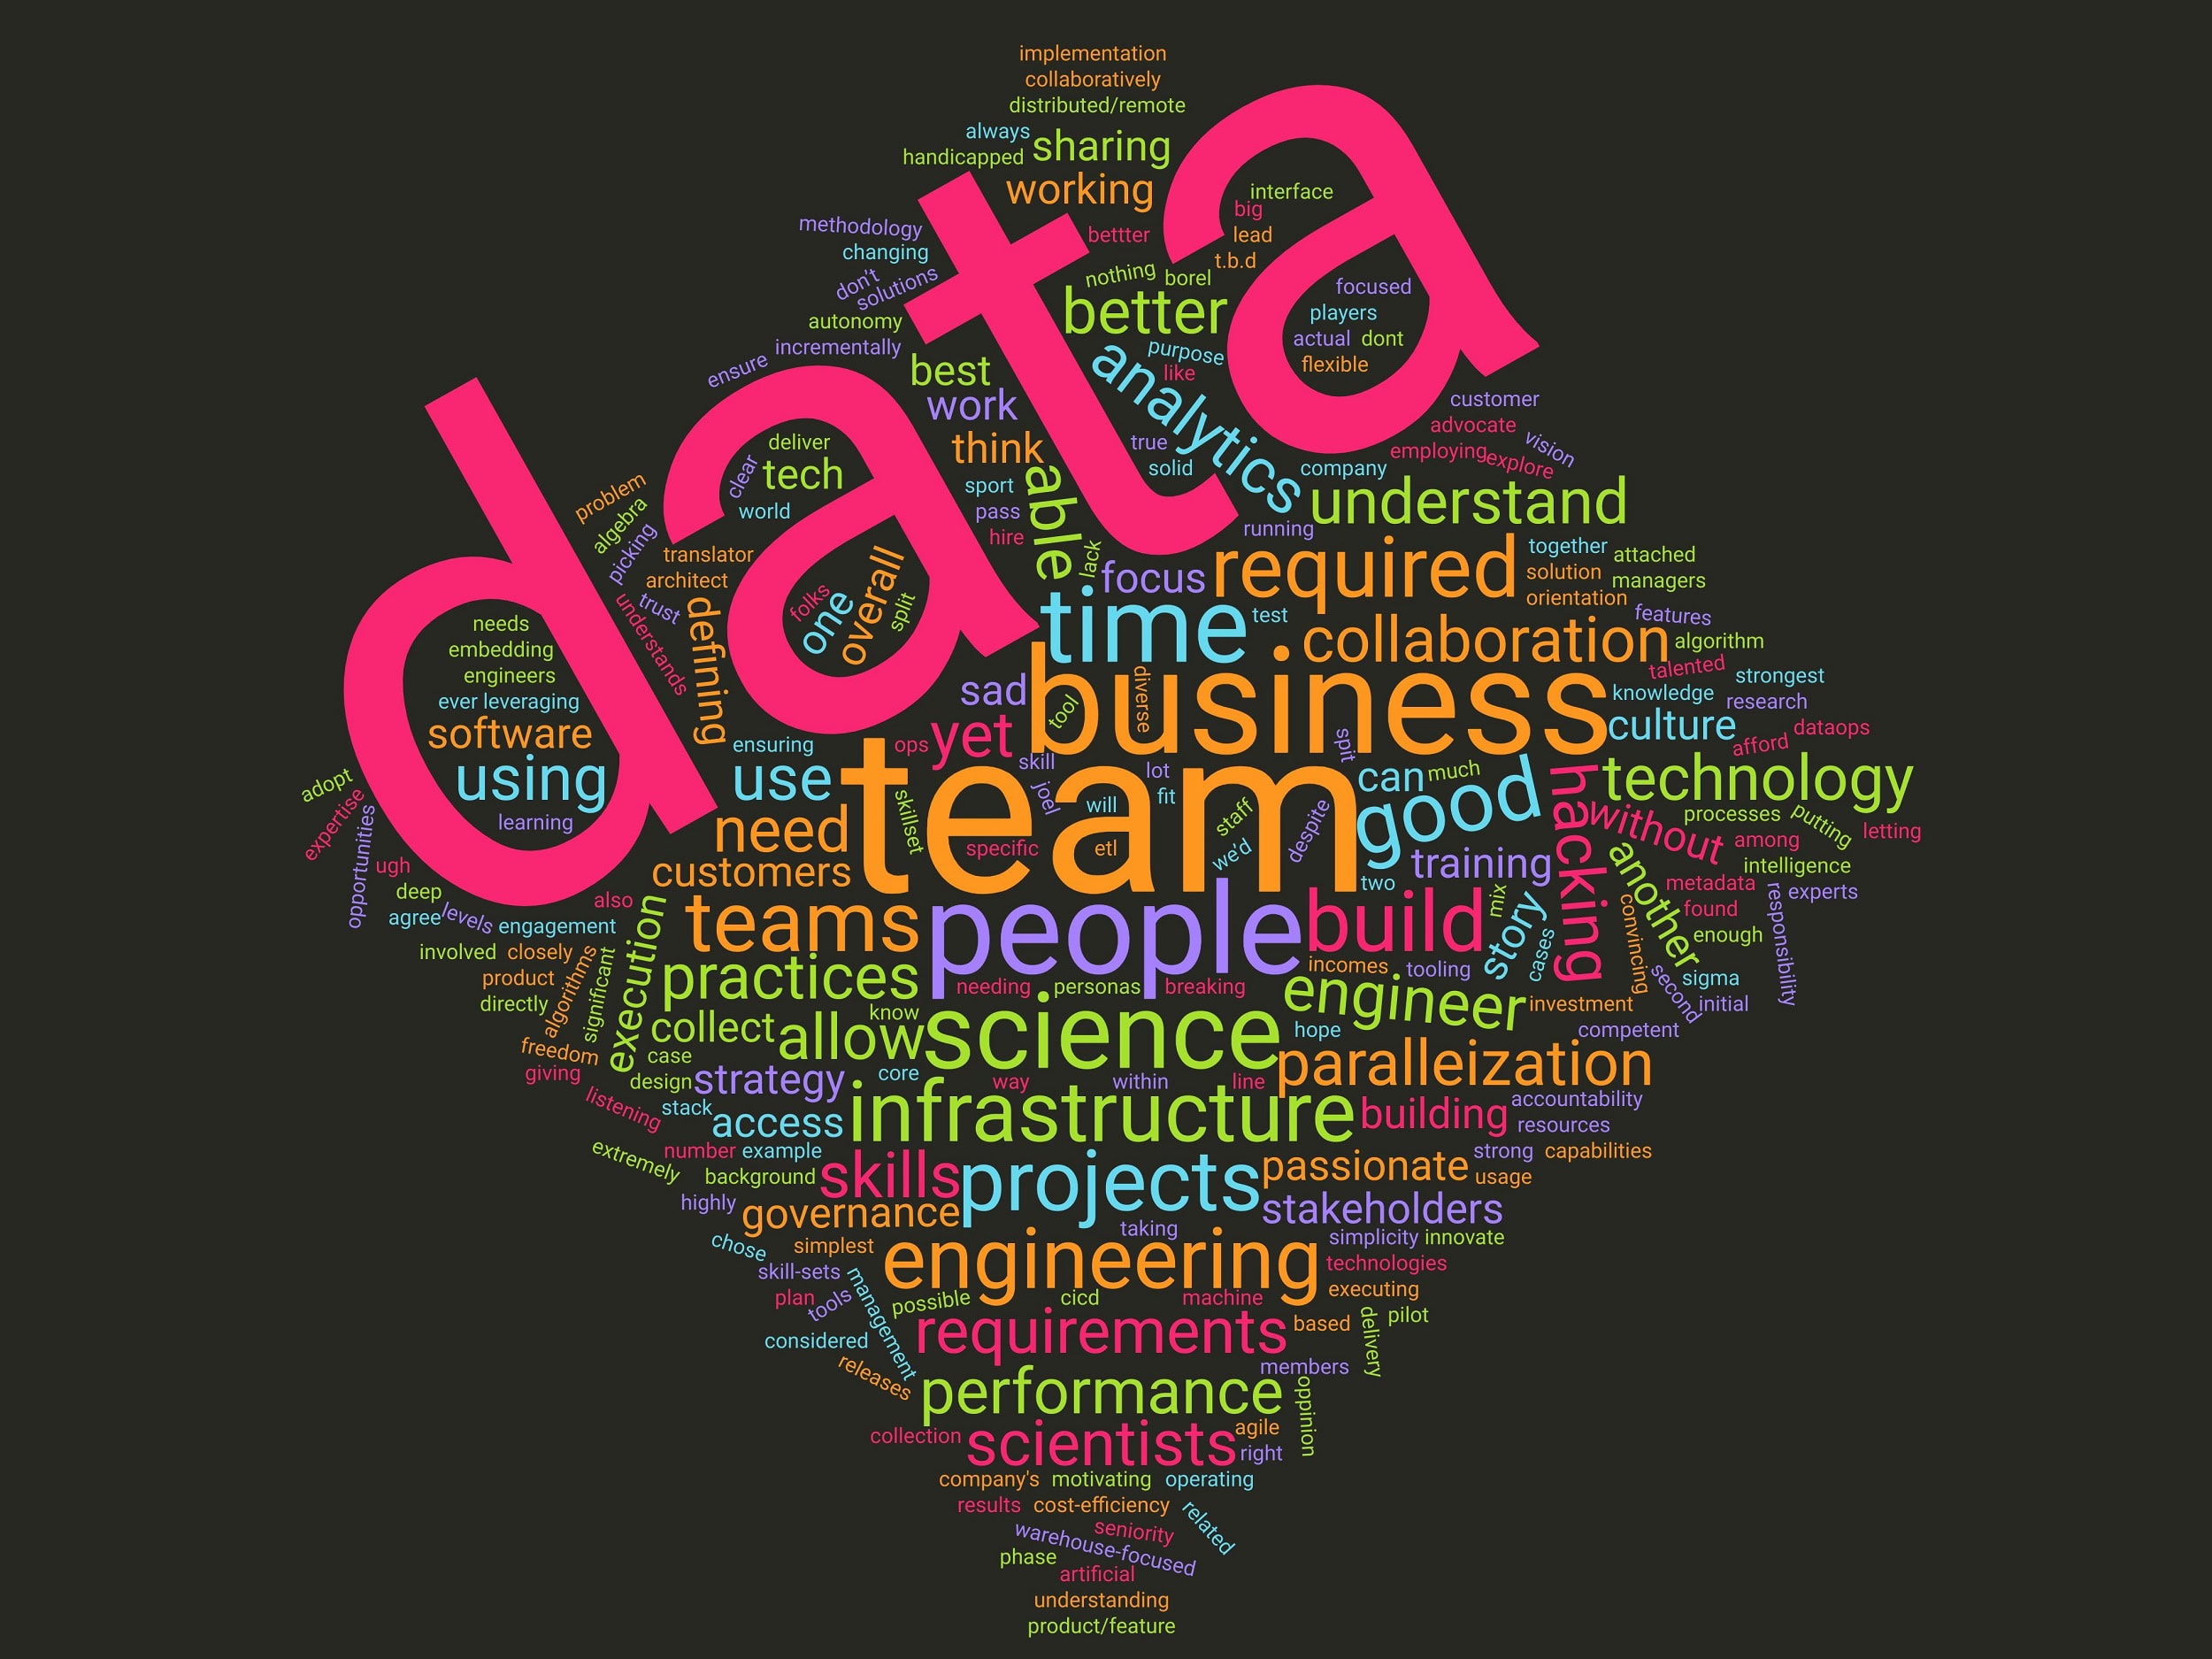
Figure 10 – Word cloud of answers to “What do you think you nailed in your management of data teams?”
To give respondents a way to provide an unfiltered opinion, I asked two questions. Both were designed to provide us with a clear understanding of what the respondents think they did well or poorly. I created a word cloud to make their responses more intelligible.
I asked, “What do you think you nailed in your management of data teams?” to get an idea of what went well. Many respondents were happy about their data teams and the people that they had.
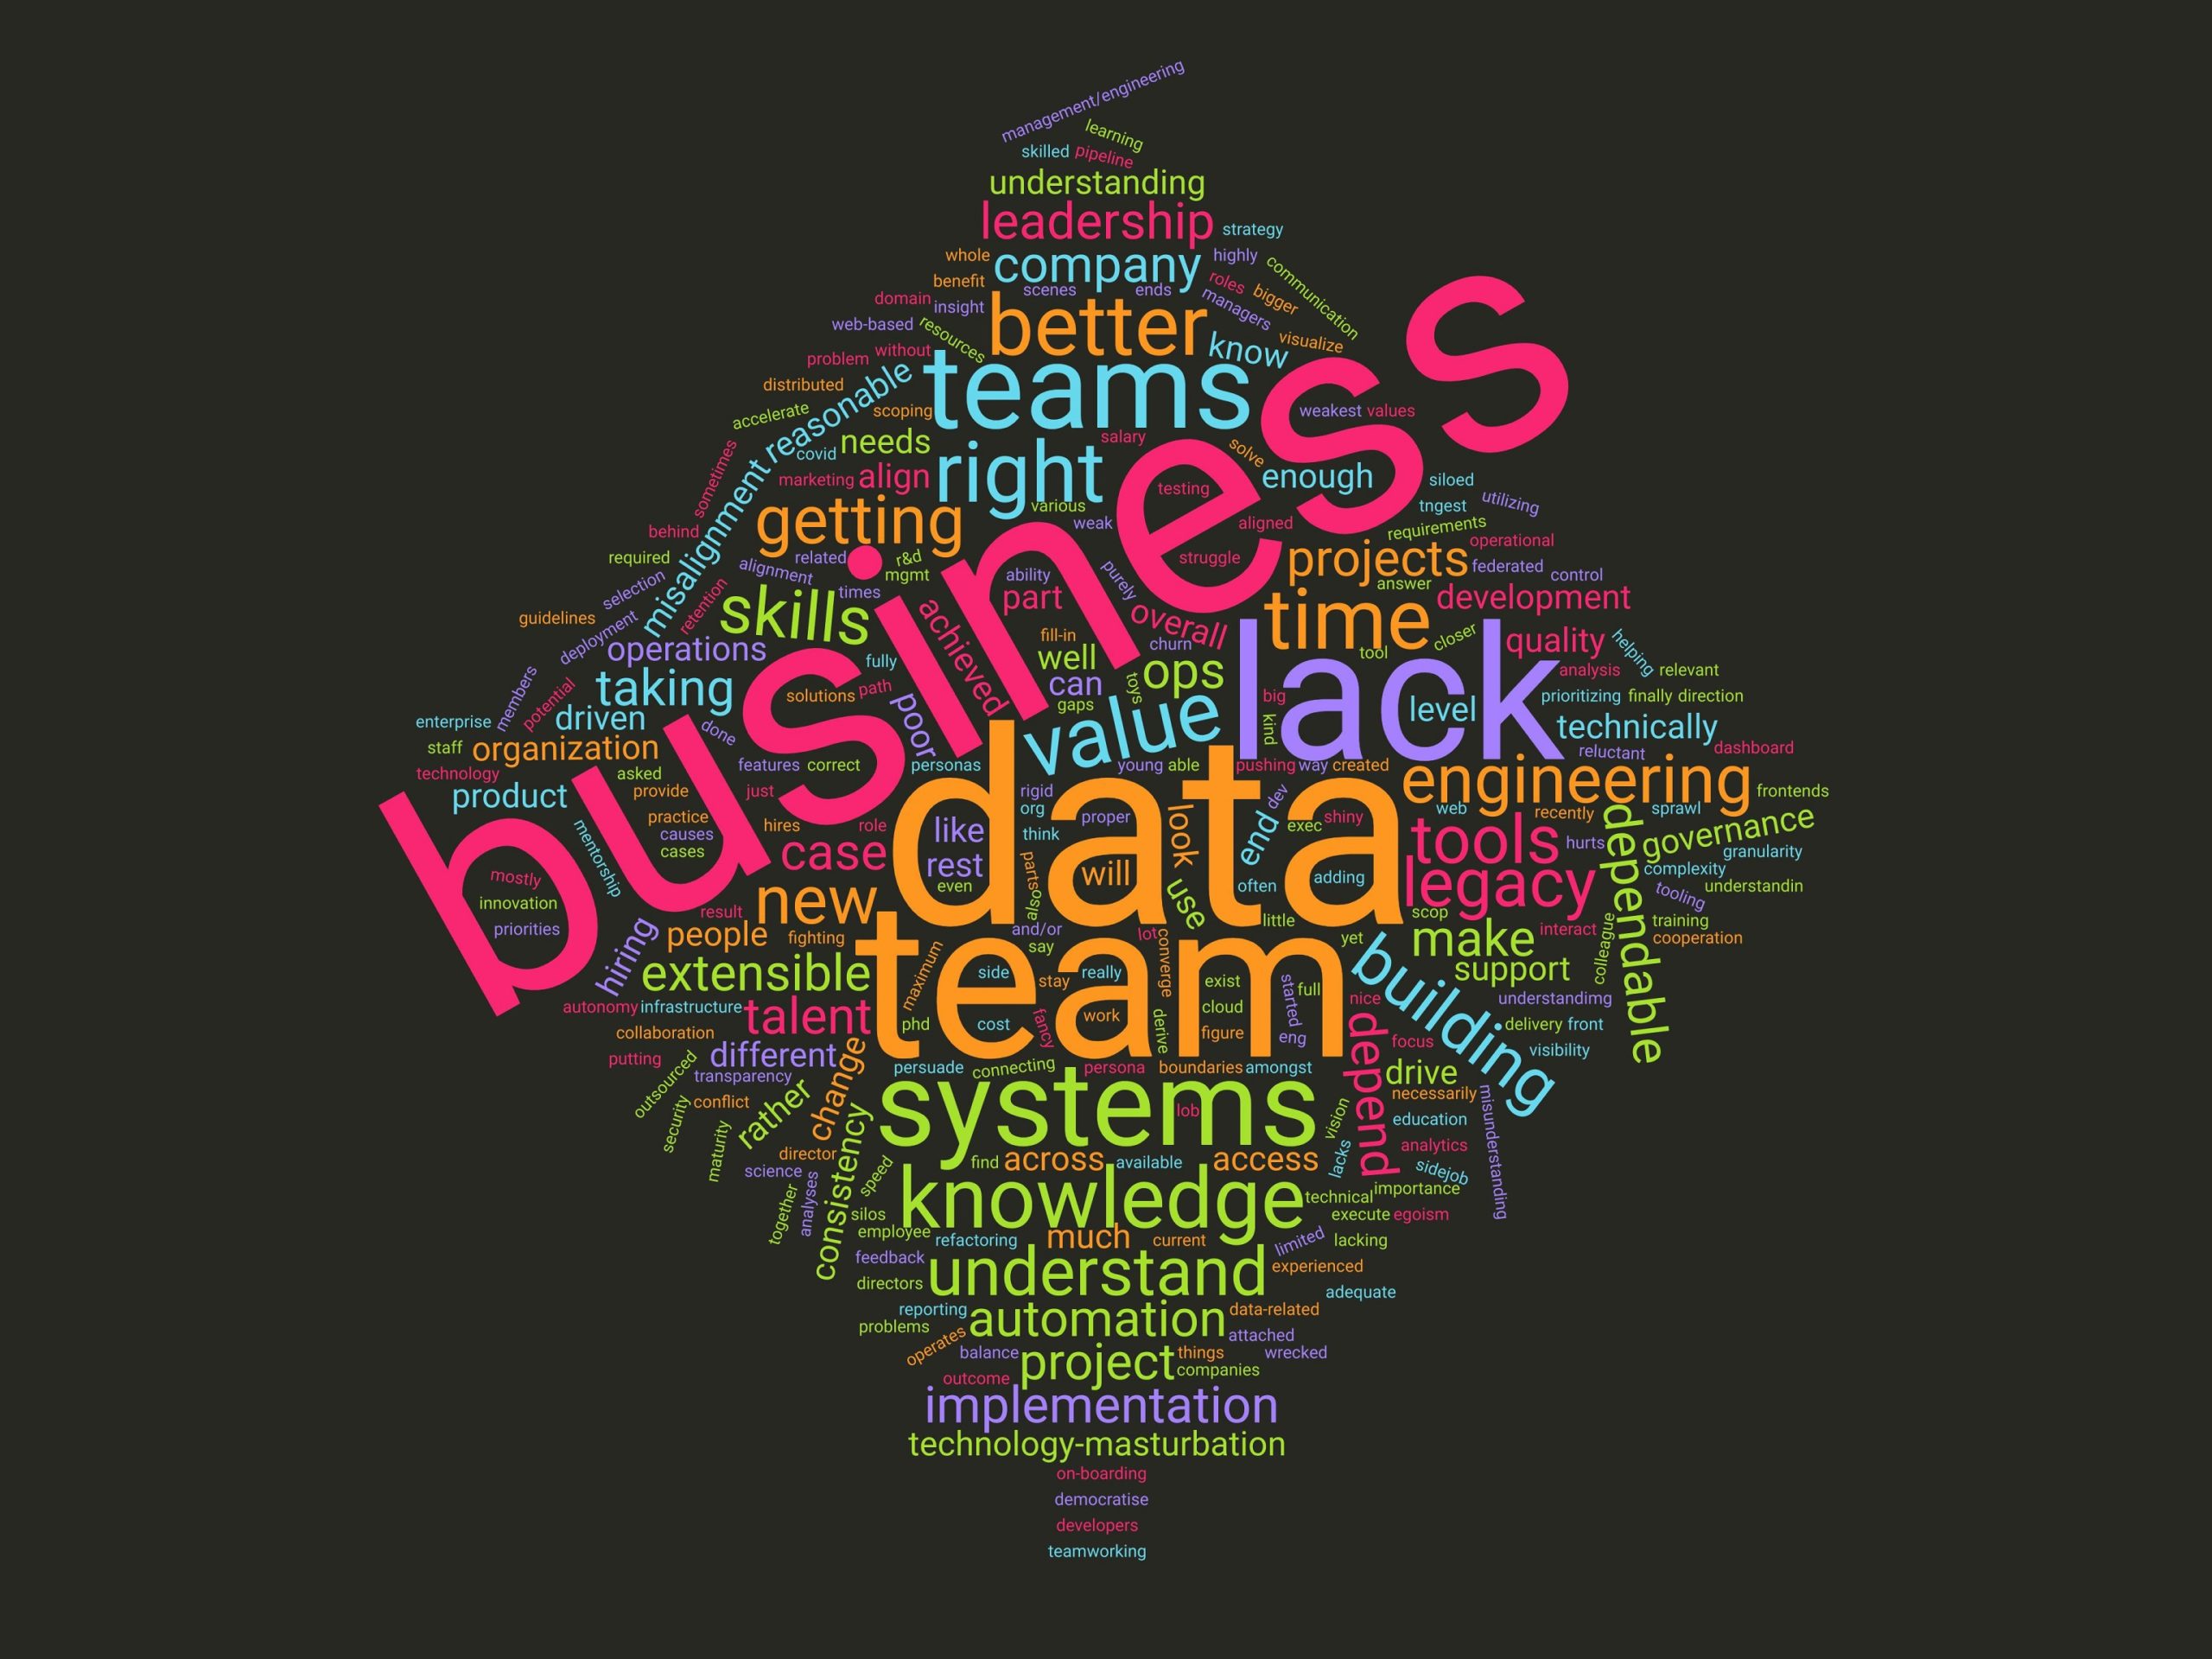
Figure 11 – Word cloud of answers to “What do you think are the weakest points in your management of data teams?”
I asked, “What do you think are the weakest points in your management of data teams?” to get an idea of what went poorly. Many respondents lamented that they didn’t connect with or work with the business side as they wished.
As you’ll notice, both of the word clouds share many of the same words. It almost seems as though the best and worst things are in conflict. The reality is that the keys to success and failure are the same. For example, the best teams focus on incorporating the business while the weakest teams fail to focus on the business.
How Did They Do It?
To get a better understanding of best and worst practices, I asked two questions to get the specific reasons why teams either were challenged to create value and what allowed them to create value.
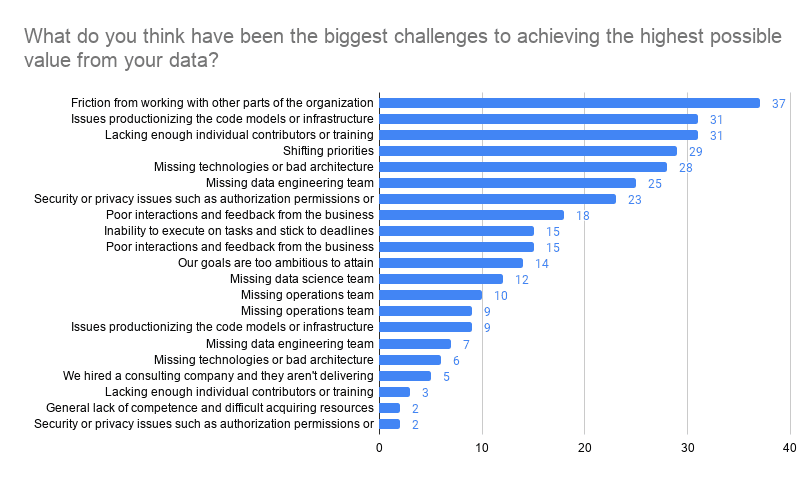
Figure 12 – What do you think have been the biggest challenges to achieving the highest possible value from your data?
The respondents consistently selected friction as their biggest challenge. After that, the two most common issues revolved around the lack of individual contributors and productionizing technologies.
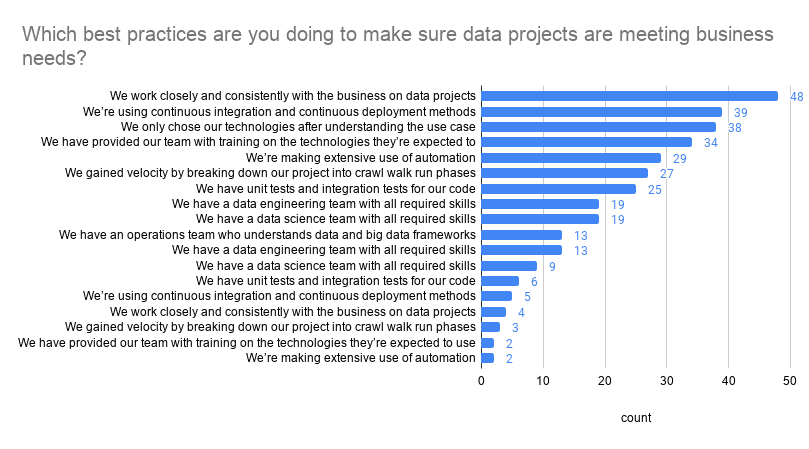
Figure 13 – Which best practices are you doing to make sure data projects are meeting business needs?
On the best practice side, we see that teams value working with the business on data projects. Three other consistent best practices were continuous integration, choosing technologies after understanding the business case, and leveraging automation to make tasks easier.
You’ll remember the questions about the value a person and the business would say was created. I found it interesting to just look at what the highest and lowest value creation respondents would say.
The highest value creation (combined score of 10) respondents selected having all of the teams with the right skills as being a best practice. They focused on creating velocity and using automation. For their write-ins, they added “listening and sharing responsibility” along with using CI/CD.
The lowest value creation (combined score of 3) respondents selected missing many, often all, of the data teams as a significant contributor to low-value creation. They also point to friction as getting in the way. Oddly enough, all of them “hired a consulting company, and they aren’t delivering,” which is a widespread way I see larger companies fail with data projects. For their write-ins, they added “shifting priorities,” “not being able to persuade the rest of the company that change is ok,” and “poor leadership”.
COVID-19 and Data Teams
To round out the survey, I wanted to get some responses on how COVID-19 affected data teams.
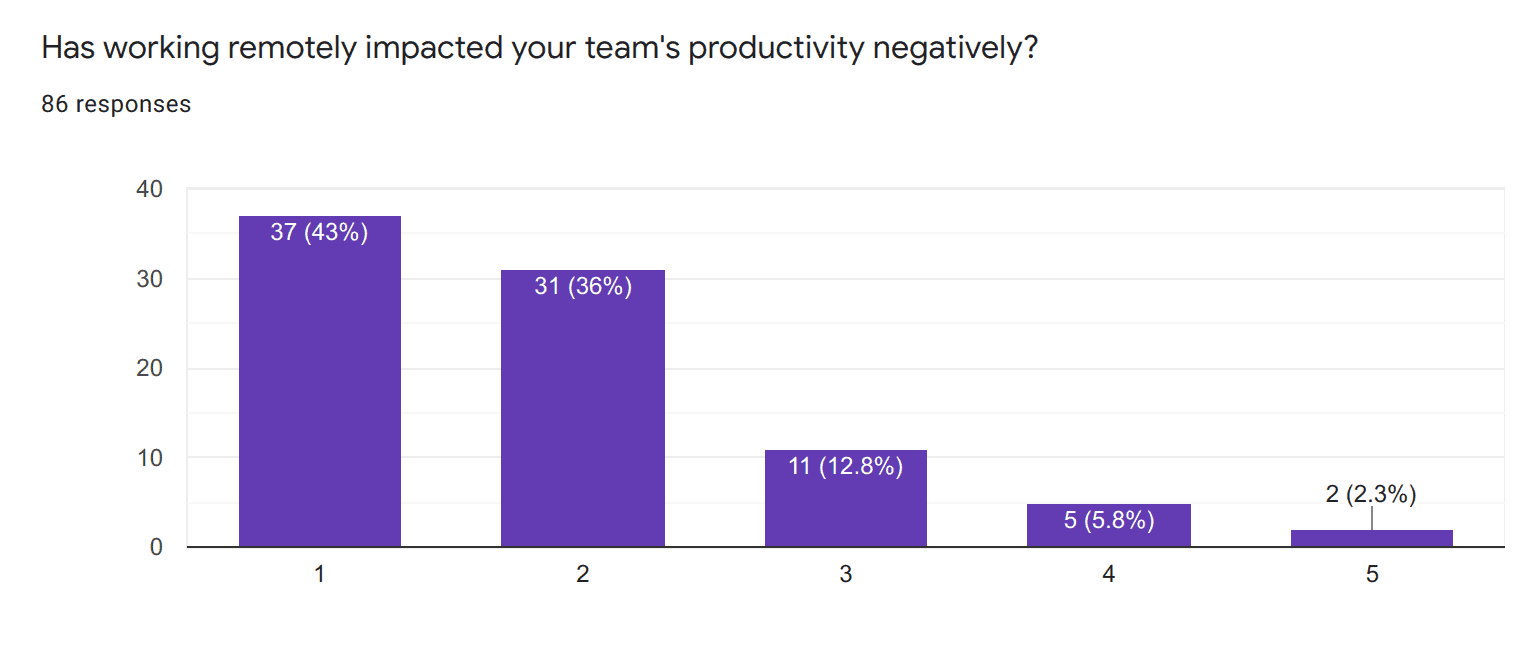
Figure 14 – Has working remotely impacted your team’s productivity negatively? 1 means “Strongly Disagree” and 5 means “Strongly Agree”.
Most data teams are working remotely right now. I wanted to figure out if this was affecting them negatively. There can be several reasons that data teams could be negatively impacted, such as home distractions, lack of cluster access, or improper cluster setups. The survey respondents said that they weren’t being affected negatively or that it was neutral.
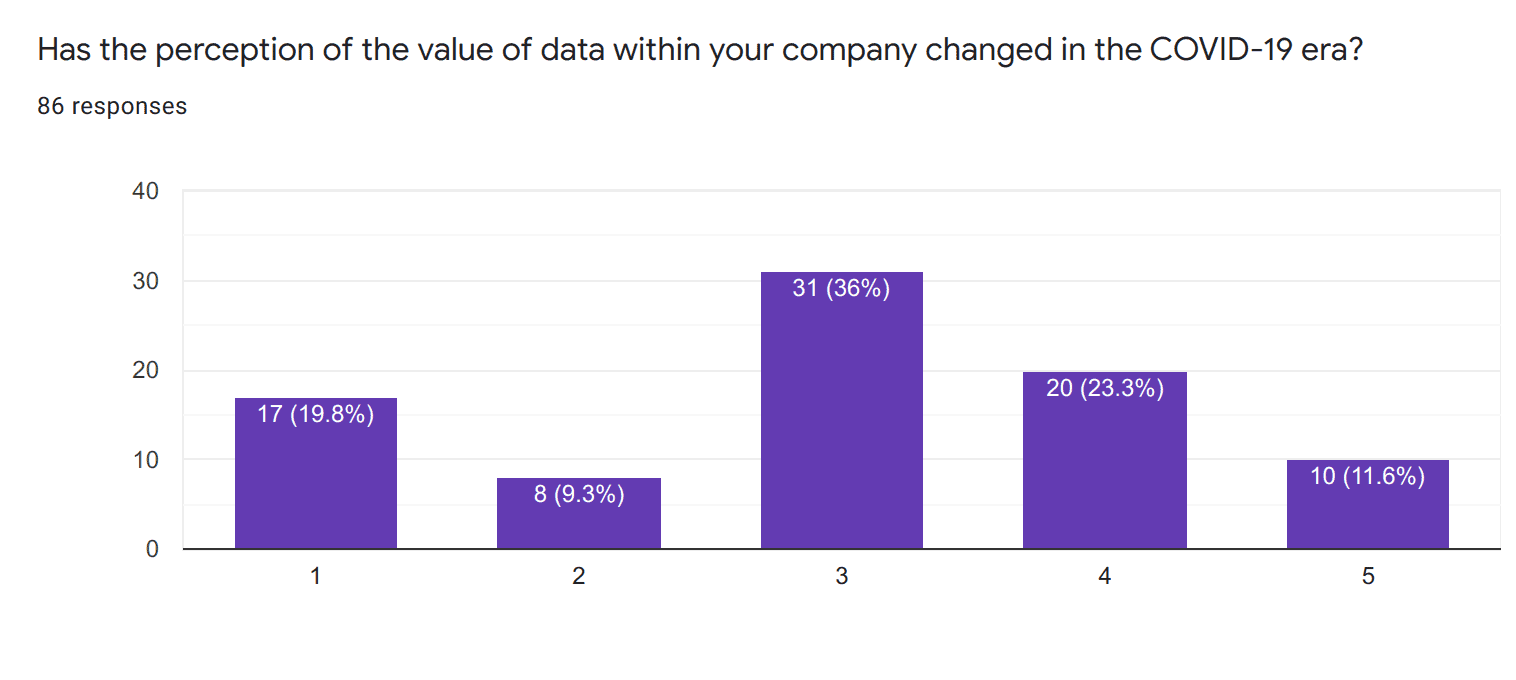
Figure 15 – Has the perception of the value of data within your company changed in the COVID-19 era? 1 means “Strongly Disagree” and 5 means “Strongly Agree”.
For some companies, COVID-19 was a wake-up call for data. I asked survey respondents to tell if COVID-19 affected the company’s perception of the value of data (higher numbers strongly agree and lower numbers strongly disagree). For the majority of respondents, COVID-19 was either neutral or agreed that their view changed.
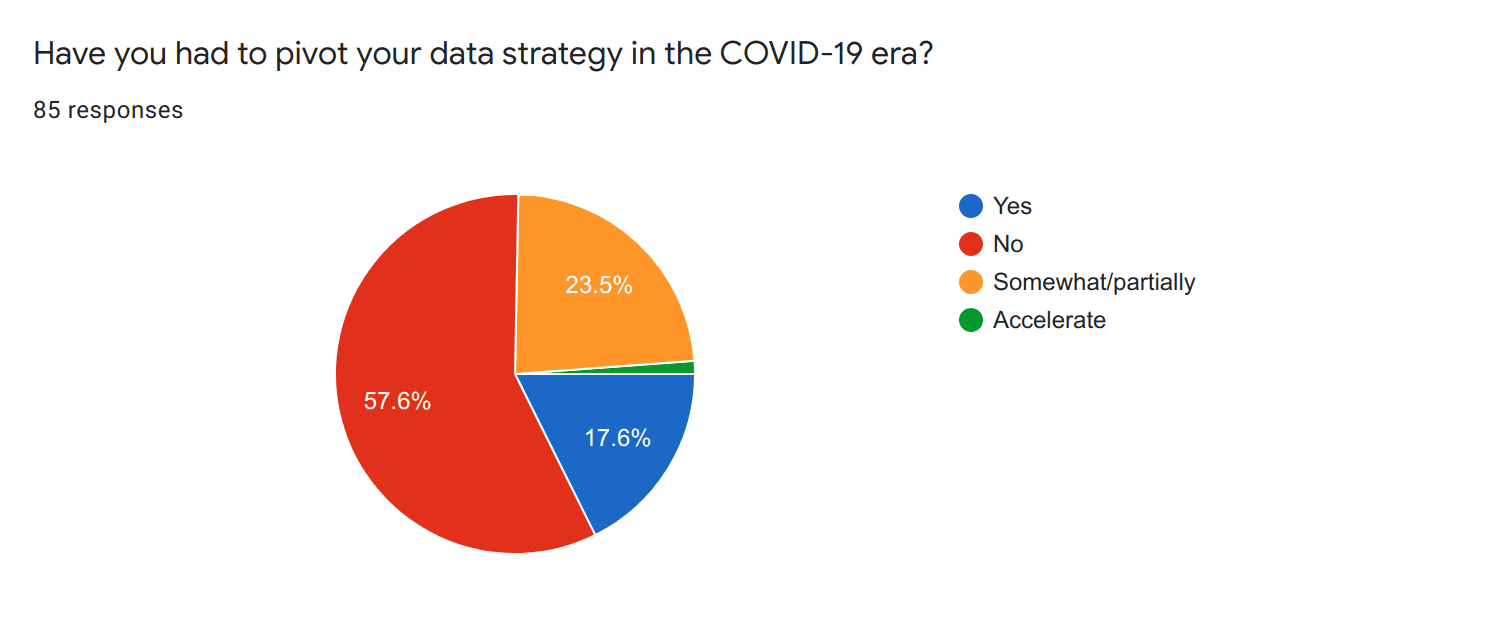
Figure 16 – Have you had to pivot your data strategy in the COVID-19 era?
COVID-19 brought tremendous changes to companies around the world. I asked if these business changes affect their data strategies. The majority of respondents said no. One respondent said it accelerated their data strategy.
Key Takeaways
The data clearly shows a correlation between value creation and having data teams. The highest value producers credit their data teams while the lowest value producers lament their lack of data teams.
The data clearly shows a correlation between value creation and having data teams. The highest value producers credit their data teams while the lowest value producers lament their lack of data teams.
It’s critical that management looks at friction and its impact on the data teams. For some companies, this means data projects go nowhere or underperform. Working well with the business side is equally important.
We can see that COVID-19 isn’t affecting the productivity of teams. In some companies, COVID-19 changes the perception of data within the company and causes them to pivot their data strategy. Management should be looking for any productivity issues and verify that their data strategy doesn’t need to be updated slightly or pivoted to leverage data better.
To help you understand and fix issues with data teams, I invite you to read Data Teams. It shares how I’ve helped companies identify and correct their organizational issues for data teams.
Frequently Asked Questions (AI FAQ by Summarizes)What was the timeframe of the survey conducted on management's use of data teams and the impact of COVID-19?
The survey was conducted between August 19, 2020, and October 17, 2020.
What positions did the 86 respondents hold in the survey?
67.5% of respondents held management positions, with other positions including data engineers, consultants, project managers, and project contributors.
What were identified as the biggest obstacles to achieving high value from data projects?
Friction, lack of individual contributors, and challenges in productionizing technologies were identified as the biggest obstacles.
What were some best practices recommended for successful data projects?
Best practices included working closely with the business, continuous integration, choosing technologies based on the business case, and leveraging automation.
What did respondents who reported the highest value creation emphasize?
Respondents emphasized having all teams with the right skills, focusing on velocity, using automation, and promoting listening and shared responsibility.
How has COVID-19 impacted data teams according to the survey?
COVID-19 is changing the perception of data within companies and causing some to pivot their data strategy, but it is not significantly affecting the productivity of teams.
What is crucial for management to monitor and consider in relation to data teams?
Management should monitor productivity issues and consider updating or pivoting their data strategy to leverage data better.
How has the perception of the value of data within companies shifted during the COVID-19 era?
The perception of the value of data within companies has shifted during the COVID-19 era.
What can lead to data projects underperforming or going nowhere?
Friction within organizations can lead to data projects underperforming or going nowhere.
What is recommended for addressing data team issues?
Consider reading 'Data Teams' for insights on identifying and correcting organizational issues.